METR's time-horizon plot, re-fitted: a Berkeley paper finds a flat stretch from 2 to 30 minutes
Two Berkeley statisticians refit METR's 228-task data. Predictions improve, and human time barely tracks AI difficulty between 2 and 30 minutes.
In this article
METR’s time-horizon plot is probably the most quoted chart in AI progress debates, and a new statistics preprint argues that its y-axis is less of a ruler than it looks. Drew Nguyen and William Fithian (Department of Statistics, UC Berkeley; arXiv, October 8) refit METR’s public data with more flexible models. Their fits predict held-out results better, and they show that human task time tracks AI difficulty only weakly between 2 and 30 minutes. We read the full text; we did not rerun the fits, and the page gives no peer-review status. It continues our reading of benchmark-validity papers such as TestJack’s audit of coding benchmarks.
What is the METR time horizon?
It is the human completion time of software tasks that an AI solves with 50% probability. The paper’s example: GPT-4’s estimated horizon is 4 minutes, so on a task a human finishes in about 4 minutes it succeeds about half the time. METR’s data have 228 hand-built software tasks in 79 task families, each with a “human time” (the geometric mean of successful, timed attempts by engineers) and an automatic scorer. For 29% of the tasks those measurements were unobtainable or invalid, and an expert’s value was used. The AIs were run repeatedly on each task. According to the paper, the public plot was updated release by release until Claude Mythos in May 2026.
What did the authors change?
They keep the data and replace the model. The baseline is a shared-slope logistic regression described in a METR research note (Barry, 2026), where AI difficulty is assumed linear in the log of human time. The paper adds two models:
- Model 1 swaps the linear term for a shared monotone spline (a cubic I-spline with four interior knots).
- Model 2 is an item-response (Rasch-type) model with a task-family effect and a correlation parameter for repeated runs. It is fit by an EM algorithm with Gauss-Hermite quadrature.
Do the new fits predict better?
Yes on point estimates, with caveats on certainty. Using 5-fold cross-validation over the 79 task families, the authors score four metrics (marginal log score, Brier score and two smoothed elementary scores) under three task weightings, 12 in all. Both new models beat the baseline on every one. Most of the gain comes from AIs whose horizons are 2 to 15 minutes, and some of their estimated horizons fall outside the original plot’s 95% intervals. The per-AI confidence intervals, though, are mostly too wide to separate from zero; the evidence accumulates only in the pooled comparison. The baseline itself already beat METR’s original per-AI logistic fit on all but one of the 12 metrics.
Why does a flat stretch matter?
Because a time-horizon jump then means different things in different places. The fitted curve from human time to AI difficulty is nearly flat between 2 and 30 minutes and roughly linear elsewhere. A rise from 3 to 30 minutes is much easier than one from 30 minutes to 5 hours, though both multiply the horizon by ten. In the authors’ conditional-success plot, the step from a 4-minute AI to a 15-minute AI looks quite small. Flat means human time says little about which tasks the AI will solve in that band.
Are run results independent?
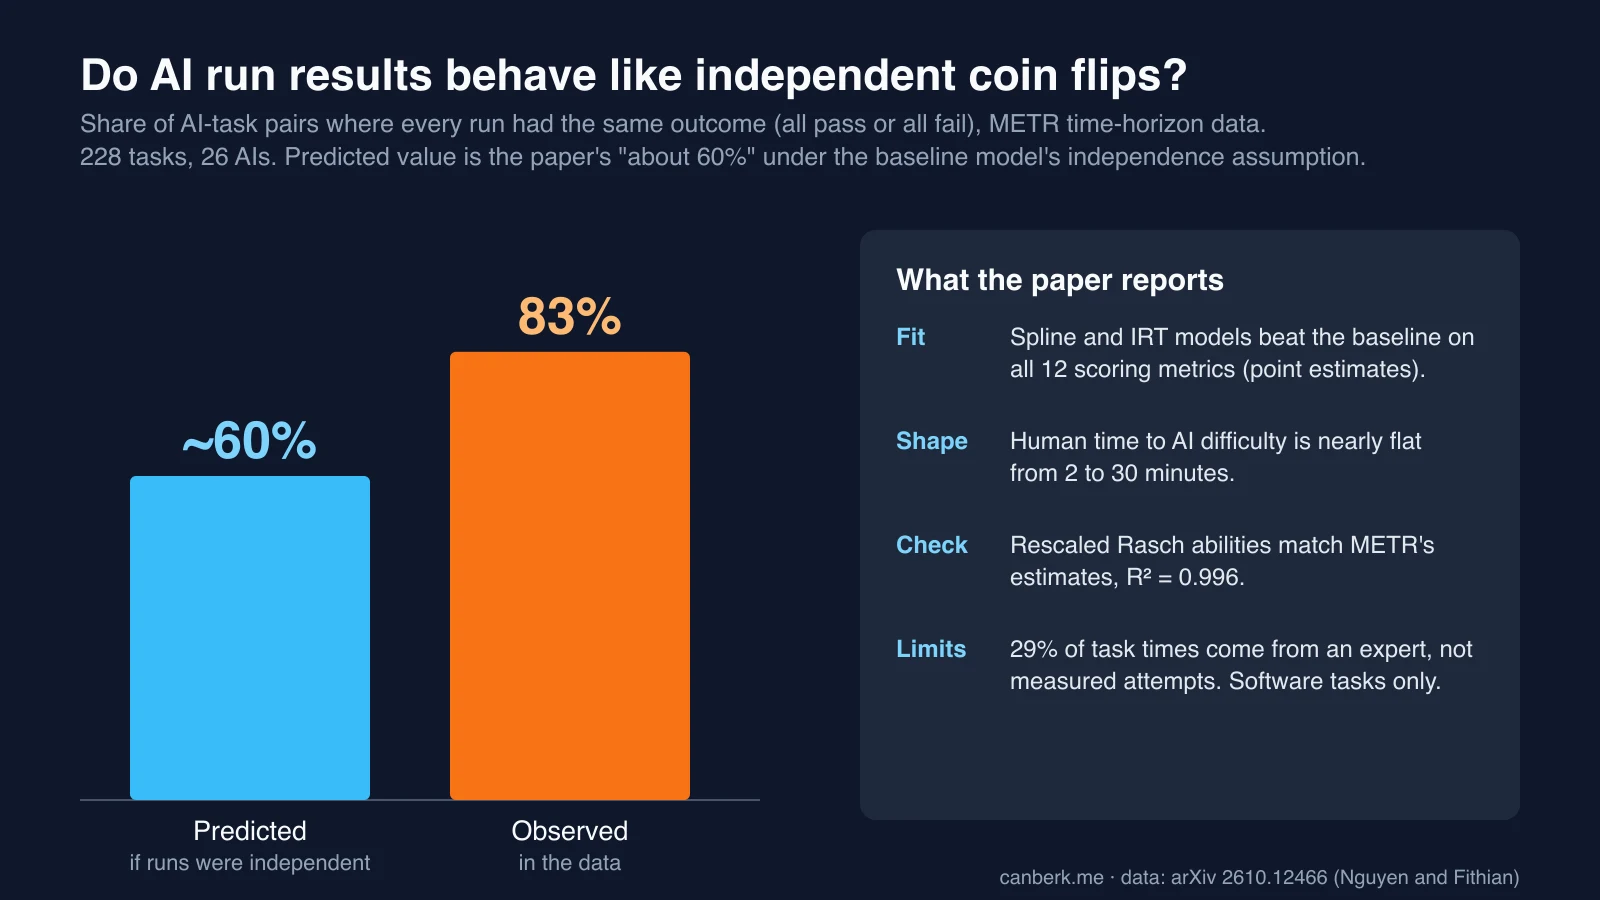
No, and the gap is large. If every run were an independent draw at the baseline’s fitted success probability, about 60% of the AI-task run sets would be unanimous (all pass or all fail). In the data, 83% are. The authors model this with an overdispersion term, which also reduces the weight of task-AI pairs with many runs.
Does this overturn the exponential trend?
The paper says it does not. Release dates are never used in the fit, and the authors write that they do not challenge the exponential growth seen in the plot. What they question is the interpretation of the unit. When they rescale their model’s Rasch abilities, which ignore the human-time conversion, the result almost matches METR’s estimates (R-squared 0.996). Their reading is that the linear model “may be inadvertently estimating another AI capability construct”, and that if the conversion is truly nonlinear, the quantity should not be called a time horizon even though it remains a useful measure of ability.
What are the limits?
The authors list them. They assume, without testing, that the tasks represent real work, that the two-number difficulty model fits and that human time has a consistent meaning across tasks; their diagnostics address only whether time predicts difficulty and whether it is comparable across ranges. Their data are METR’s, covering software tasks only, with human times up to about 30 hours and expert-supplied values for 29% of tasks. They add that if the suite were extended to longer tasks, nothing guarantees the roughly linear relationship would hold; later ranges could again be flat or steep, and only their diagnostic plots, not a linearity check, would show it. This is one re-analysis of one public dataset by two authors.
What to keep in mind
These are our observations:
- Quote horizons with their range. If you cite a doubling time, note that the paper’s fit says a ten-fold jump is not the same size everywhere on the plot.
- The direction of progress is unchanged. The authors take the observed growth as given and question only what the units mean.
- Run-to-run correlation matters for any benchmark. If runs are far more unanimous than independent trials would be, averaging a few runs overstates how much information they carry. That is a point for anyone sizing evaluations, and it echoes how a single benchmark score can shift with how a test is written.
Editorial review: October 10, 2026 (AI). Prepared from the full text of arXiv 2610.12466 (v1, October 8; HTML version, including Sections 1 to 4 and the appendix captions). We did not rerun the models or look at METR’s data and notes; the chart is ours and uses only figures stated in Section 2.3. “What to keep in mind” is ours.
Sources
Created with AI assistance.
Suggest a correction
Found an error or a missing source? Send a private suggestion to the editor. It will be reviewed and will not appear as a public comment. No name, email or account is needed.


Send us a message